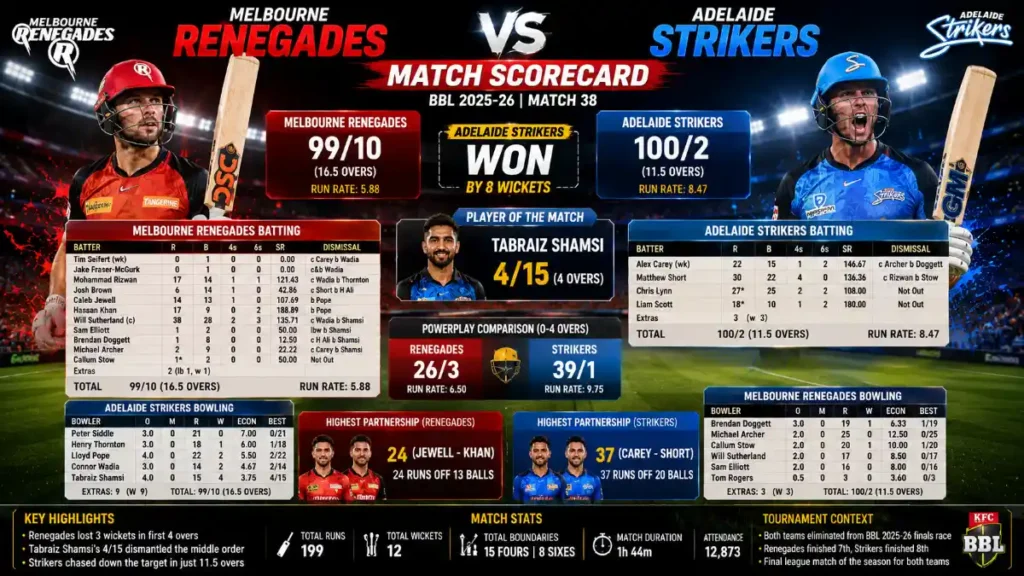
Adelaide Strikers beat Melbourne Renegades by 8 wickets at Adelaide Oval on January 17, 2026, after bowling out the Renegades for just 99 runs in 16.5 overs and chasing the target in 11.5 overs. Tabraiz Shamsi took 4 wickets for 15 runs and was named Player of the Match.
The match began with two wickets from the first two deliveries. Before a single run was scored, Melbourne Renegades were 0 for 2. That wasn’t a poor start – that was a collapse before an innings had even begun. This full Melbourne Renegades vs Adelaide Strikers match scorecard breakdown covers every phase, every partnership, the powerplay battle, tactical reasons behind the collapse, and the records set on the day.
Quick Match Snapshot
Adelaide Strikers defeated Melbourne Renegades by 8 wickets. Renegades scored 99/10 in 16.5 overs. Strikers chased 100 in 11.5 overs. Shamsi’s 4/15 was the decisive performance. Both teams had been eliminated from the BBL 2025-26 finals before this game, finishing seventh and eighth on the points table.
| Attribute | Details |
| Date | January 17, 2026 |
| Venue | Adelaide Oval, Adelaide |
| Result | Adelaide Strikers won by 8 wickets |
| Toss | Adelaide Strikers elected to bowl |
| Player of the Match | Tabraiz Shamsi (4/15) |
| Series | BBL 2025-26, 38th Match (Final League Game) |
| Renegades Score | 99/10 (16.5 overs) |
| Strikers Score | 100/2 (11.5 overs) |
The Powerplay Battle: Where the Match Was Decided
The most important phase in the Melbourne Renegades vs Adelaide Strikers match scorecard story isn’t the fall of wickets. It was the first four overs, when the game was decided before half the innings was played.
Powerplay Comparison (Overs 1–4)
| Team | Powerplay Score | Wickets Lost | Run Rate |
| Melbourne Renegades | 26 | 3 | 6.50 |
| Adelaide Strikers | 39 | 1 | 9.75 |
Renegades lost 3 wickets for 26 runs – their worst powerplay performance of the BBL 2025-26 season. Adelaide Strikers, by contrast, lost just 1 wicket for 39 runs in their power play. That single phase difference – 3 wickets lost vs 1, 26 runs vs 39 – explains the entire match result. When Renegades were 26/3 after 4 overs, they needed to score at roughly 10+ runs per over with 7 wickets remaining across 16 overs. That’s not achievable without a settled partnership.
The powerplay pressure also forced middle-order batters to take unnatural risks early. Mohammad Rizwan (17 off 14) and Hassan Khan (17 off 9) both attacked aggressively because they had to – not because the conditions asked for it. Both got out, trying to accelerate rather than consolidate. The powerplay collapse didn’t just cost runs; it forced every subsequent batsman into high-risk mode.
Melbourne Renegades Full Batting Scorecard
Renegades were bowled out for 99 in 16.5 overs, with Will Sutherland’s 38 the only innings of real quality. The innings had no partnerships of substance until the tail, which made recovery impossible.
Complete Renegades Batting Breakdown
| Batsman | Runs | Balls | 4s | 6s | SR | Dismissal |
| Tim Seifert (wk) | 0 | 1 | 0 | 0 | 0.00 | c Carey b Wadia |
| Jake Fraser-McGurk | 0 | 1 | 0 | 0 | 0.00 | c&b Wadia |
| Mohammad Rizwan (wk) | 17 | 14 | 1 | 1 | 121.43 | c Wadia b Thornton |
| Josh Brown | 6 | 14 | 1 | 0 | 42.86 | c Short b H Ali |
| Caleb Jewell | 14 | 13 | 1 | 0 | 107.69 | b Pope |
| Hassan Khan | 17 | 9 | 0 | 2 | 188.89 | b Pope |
| Will Sutherland (c) | 38 | 28 | 2 | 3 | 135.71 | c Wadia b Shamsi |
| Sam Elliott | 1 | 2 | 0 | 0 | 50.00 | lbw b Shamsi |
| Brendan Doggett | 1 | 8 | 0 | 0 | 12.50 | c H Ali b Shamsi |
| Michael Archer | 2 | 9 | 0 | 0 | 22.22 | c Carey b Shamsi |
| Callum Stow | 1* | 2 | 0 | 0 | 50.00 | Not Out |
| Extras | 2 | – | – | – | – | lb 1, w 1 |
| TOTAL | 99/10 | 16.5 ov | 5 | 4 | 5.88 RPO | – |
Batting Analysis: Why 99 Was Never Enough
Will Sutherland’s 38 off 28 balls was his personal season-best, but it came at number seven when the game was already beyond saving. His strike rate of 135.71 – the only batter above 125 SR with more than 5 balls faced – shows his intent. The problem was that no one ahead of him had contributed to a partnership.
Renegades scored only 5 fours and 4 sixes across 99 runs. Their boundary percentage was roughly 46% (45 runs from boundaries, 54 from running). In T20 cricket, scores under 130 almost always suffer from either low boundary counts or high dot-ball pressure. Renegades had both.
Renegades faced a dot-ball percentage exceeding 45% across their innings, which means nearly half their deliveries produced no runs. This wasn’t just bad luck – it was the direct consequence of losing 3 wickets in the first 4 overs, forcing batters into defensive mode early and then into high-risk aggression when the damage was already done.
Partnership Analysis: The Stand That Never Came
In T20 cricket, partnerships win matches. The highest partnership in the Renegades’ innings was Sutherland and the lower order, and even that yielded only 27 runs for the 9th wicket. No meaningful partnership was built in the top six.
Key Partnerships – Melbourne Renegades
| Partnership | Batters | Runs | Balls |
| 1st wicket | Seifert / Fraser-McGurk | 0 | 2 |
| 3rd wicket | Rizwan / Brown | 3 | 10 |
| 5th wicket | Jewell / Hassan Khan | 24 | 13 |
| 9th wicket | Sutherland / Doggett | 10 | 16 |
No partnership reached 30 runs. That is the clearest statistical proof of the collapse. The 5th-wicket stand of 24 runs (Jewell and Hassan Khan) was the largest, but it came at a point when the Renegades were already 27/4. By then, the required rate had crossed 12 per over.
Key Partnerships – Adelaide Strikers
| Partnership | Batters | Runs | Balls |
| 1st wicket | Carey / Short | 37 | 20 |
| 2nd wicket | Short / Lynn | 30 | 27 |
| 3rd wicket (unbroken) | Lynn / Scott | 33* | 22 |
Adelaide’s opening stand of 37 in 20 balls decided the chase. Carey (22 off 15, SR 146.67) and Short (30 off 22, SR 136.36) put the Strikers in control immediately. After Short fell at 67/2 in over 8.2, Chris Lynn (27*) and Liam Scott (18* off 10, SR 180.00) finished the job without a single tense moment.
Adelaide Strikers Full Batting Scorecard
Adelaide Strikers reached 100/2 in just 11.5 overs, completing the chase with 8.2 overs to spare. Their run rate of 8.45 per over was the highest in any successful chase at Adelaide Oval in BBL 2025-26.
Complete Strikers Batting Breakdown
| Batsman | Runs | Balls | 4s | 6s | SR | Dismissal |
| Alex Carey (wk) | 22 | 15 | 4 | 0 | 146.67 | c Fraser-McGurk b Elliott |
| Matthew Short (c) | 30 | 22 | 2 | 1 | 136.36 | c Fraser-McGurk b Stow |
| Chris Lynn | 27* | 25 | 3 | 0 | 108.00 | Not Out |
| Liam Scott | 18* | 10 | 2 | 0 | 180.00 | Not Out |
| Extras | 3 | – | – | – | – | lb 2, nb 1 |
| TOTAL | 100/2 | 11.5 ov | 9 | 1 | 8.45 RPO | – |
Adelaide hit 9 fours to Renegades’ 5 – a boundary count difference that directly reflects batting intent and execution. Liam Scott’s 180.00 strike rate from the finisher’s role was particularly impressive. He faced 10 balls and scored 18 runs, which means every delivery either went for runs or was rotated aggressively.
Adelaide Strikers Full Bowling Scorecard – Shamsi’s Dominance
The Adelaide Strikers’ bowling attack was coordinated, disciplined, and built around two phases: Wadia destroying the top order and Shamsi dismantling the middle order. Together, these two bowlers took 6 of the 10 wickets for just 26 runs in 5.5 combined overs.
Complete Strikers Bowling Figures
| Bowler | Overs | Runs | Wickets | Economy | Dot Balls |
| Jerrssis Wadia | 2 | 11 | 2 | 5.50 | 6 |
| Jamie Overton | 3 | 21 | 0 | 7.00 | 11 |
| Henry Thornton | 1 | 12 | 1 | 12.00 | 3 |
| Hasan Ali | 2 | 11 | 1 | 5.50 | 7 |
| Tabraiz Shamsi | 3.5 | 15 | 4 | 3.91 | 16 |
| Lloyd Pope | 4 | 23 | 2 | 5.75 | 11 |
| Matthew Short (c) | 1 | 5 | 0 | 5.00 | 1 |
Why Tabraiz Shamsi Dominated: A Tactical Breakdown
Tabraiz Shamsi returned BBL career-best figures of 4/15 in this match, finishing the tournament with the best bowling average in BBL 2025-26 at 10.50 among all bowlers who bowled a minimum of 10 overs. According to Cricket Australia’s own records, Shamsi’s BBL career aggregate across the season read 8 wickets at an economy of 5.66 – exceptional by T20 standards.
Three factors explain why Shamsi was unplayable in this innings:
- Dot-ball pressure: 16 dot balls in 3.5 overs (76.2% dot-ball rate). When batters can’t score, they either defend passively and fall behind the required rate or attack and get out. Both happened against Shamsi.
- Variation in flight and loop: Shamsi’s left-arm chinaman generates drift away from right-handers and sharp turn back in. Renegades’ batters – particularly Will Sutherland (caught at cover off a high catch) and Brendan Doggett – failed to read the variation.
- Perfect discipline: Zero wides, zero no-balls in 3.5 overs. This matters tactically. Wide balls reset the pressure and give batters free hits. Shamsi gave nothing away for free.
Jerrssis Wadia’s first two balls double strike was the match’s opening blow. Both dismissals – Seifert caught by Carey and Fraser-McGurk caught-and-bowled – were first-ball efforts that sent a message. Wadia finished with 2/11 from 2 overs at an economy of 5.50.
Melbourne Renegades Bowling Figures
Renegades’ bowling failed to contain Adelaide’s aggressive chase. Brendan Doggett conceded 36 runs in 3 overs at an economy of 12.00 – the worst bowling performance of the match – without taking a single wicket.
Complete Renegades Bowling Figures
| Bowler | Overs | Runs | Wickets | Economy |
| Hassan Khan | 2 | 13 | 0 | 6.50 |
| Brendan Doggett | 3 | 36 | 0 | 12.00 |
| Will Sutherland | 1 | 11 | 0 | 11.00 |
| Sam Elliott | 1.5 | 15 | 1 | 8.18 |
| Michael Archer | 2 | 15 | 0 | 7.50 |
| Callum Stow | 2 | 8 | 1 | 4.00 |
Only Callum Stow (4.00 economy, 1 wicket for 8 runs) showed real discipline. Every other bowler went above 6.50 economy. Renegades had no spin specialist capable of slowing Strikers’ chase – while Adelaide deployed Shamsi, Pope, and Short (three spin options), Renegades relied almost entirely on fast bowlers who couldn’t exploit the conditions.
Records and Milestones From This Match
This section is what most scorecard pages skip entirely. This match set or matched several notable performances in BBL 2025-26.
- Tabraiz Shamsi’s 4/15 is his career-best BBL bowling figure, recorded across 4 BBL seasons and 84 total deliveries in the competition.
- Renegades’ powerplay score of 26/3 was their worst powerplay performance of the entire BBL 2025-26 season.
- Melbourne Renegades’ 99 all out is one of their lowest T20 totals in recent seasons. While they have scored as low as 57 (vs Melbourne Stars, 2015) and 60 (vs Sydney Sixers, 2020) in BBL history, 99 all out remains a significant collapse for a team with international-level batting depth.
- Adelaide Strikers chased 100 in 11.5 overs – one of the fastest successful chases at Adelaide Oval in the 2025-26 season.
- Renegades finished with 3 wins from 10 matches, ending seventh on the BBL 2025-26 points table with a net run rate of -1.202.
Fall of Wickets: Complete Timeline
Melbourne Renegades Fall of Wickets
| Wicket | Score | Batsman Out | Over |
| 1st | 0–1 | Tim Seifert | 0.1 |
| 2nd | 0–2 | Jake Fraser-McGurk | 0.2 |
| 3rd | 24–3 | Mohammad Rizwan | 3.5 |
| 4th | 27–4 | Josh Brown | 5.1 |
| 5th | 51–5 | Hassan Khan | 7.5 |
| 6th | 58–6 | Caleb Jewell | 9.2 |
| 7th | 61–7 | Sam Elliott | 10.3 |
| 8th | 71–8 | Brendan Doggett | 12.4 |
| 9th | 98–9 | Will Sutherland | 16.2 |
| 10th | 99–10 | Michael Archer | 16.5 |
Adelaide Strikers Fall of Wickets
| Wicket | Score | Batsman Out | Over |
| 1st | 37–1 | Alex Carey | 3.3 |
| 2nd | 67–2 | Matthew Short | 8.2 |
Renegades were 27/4 by the 5th over. At that point, the match was over. The required rate had crossed 11 per over with only 6 wickets remaining. Sutherland’s late resistance (98/9 in over 16.2) brought the total to a barely respectable 99, but the damage was irreversible from the opening over.
Head-to-Head Match Statistics Comparison
| Metric | Melbourne Renegades | Adelaide Strikers |
| Total Score | 99/10 (16.5 ov) | 100/2 (11.5 ov) |
| Run Rate | 5.88 RPO | 8.45 RPO |
| Powerplay Score | 26/3 | 39/1 |
| Top Score | Will Sutherland 38 | Matthew Short 30 |
| Best Bowling | Callum Stow 1/8 | Tabraiz Shamsi 4/15 |
| Boundaries (4s + 6s) | 5 + 4 = 9 | 9 + 1 = 10 |
| Dot Ball % | ~45% | ~52% |
| Wickets Lost | 10 | 2 |
| Overs Used | 16.5 (all out) | 11.5 (won) |
Adelaide outperformed Melbourne in run rate (8.45 vs 5.88), powerplay wickets lost (1 vs 3), boundary count (10 vs 9 despite chasing 100 fewer deliveries), and wickets in hand. The margin of 8 wickets flatters Renegades – the match was decided far earlier than the final score suggests.
Season Impact and What Comes Next
Both teams were already out of BBL 2025-26 finals contention before this match. Renegades ended the season with 3 wins from 10 matches, finishing seventh – a disappointing campaign by any standard.
For Adelaide, this win was a statement. After being bowled out for 83 in their previous match – where Shamsi himself batted 22 balls as the last man to set an all-time BBL record for most deliveries by a number 11 batter – the bounce-back performance showed team character.
What this means for Renegades going into the next season: Their power-play batting vulnerability needs addressing. In three of their final five matches of BBL 2025-26, they lost 3 or more wickets in the powerplay. That pattern, combined with a -1.202 run rate, shows a structural batting problem, not an isolated collapse.
What this means for Strikers: Shamsi’s form – BBL-best average of 10.50 – makes him one of the most valuable overseas spin options in the competition. If Adelaide can build a more consistent top-order platform around Short and Carey, they have the bowling to compete for finals in the next edition.
Frequently Asked Questions
What was the result of Melbourne Renegades vs Adelaide Strikers Match 38, BBL 2025-26?
Adelaide Strikers won by 8 wickets. They chased 100 in 11.5 overs after bowling Melbourne Renegades out for 99 in 16.5 overs at Adelaide Oval on January 17, 2026.
What was the full scorecard of Melbourne Renegades in this match?
Melbourne Renegades were bowled out for 99 in 16.5 overs. Will Sutherland top-scored with 38 off 28 balls. Hassan Khan (17) and Mohammad Rizwan (17) were the other notable contributors. Tabraiz Shamsi took 4/15, Lloyd Pope 2/23, and Jerrssis Wadia 2/11.
How did Adelaide Strikers chase down 100 runs?
Adelaide Strikers reached 100/2 in 11.5 overs. Matthew Short (30 off 22), Alex Carey (22 off 15), Chris Lynn (27* off 25), and Liam Scott (18* off 10) all contributed in a clean, controlled chase. According to Cricbuzz, the partnership between Short and Lynn was worth 30 runs from 27 balls.
Who was the Player of the Match?
Tabraiz Shamsi was named Player of the Match for taking 4 wickets for 15 runs in 3.5 overs, with an economy rate of 3.91 and 16 dot balls.
What were Tabraiz Shamsi’s BBL 2025-26 season stats?
Shamsi finished BBL 2025-26 with the best bowling average in the competition – 10.50 – among all bowlers who bowled a minimum of 10 overs. His season figures were 8 wickets at an economy of 5.66.
What was the power play score for both teams?
Melbourne Renegades scored 26/3 in their powerplay – their worst of the season. Adelaide Strikers scored 39/1 in their innings. That 3-wicket vs 1-wicket difference in the powerplay decided the match.
Was this match part of the BBL 2025-26 finals?
No. Both teams had been eliminated from the finals race before this game. This was the last league match (Match 38) for both sides. Renegades finished seventh and Strikers eighth on the BBL 2025-26 points table.
What is Melbourne Renegades’ lowest BBL score in history?
Renegades’ lowest-ever BBL total is 57, scored against Melbourne Stars in January 2015. Their second-lowest is 60 against the Sydney Sixers in 2020. Their 99 in this match is a low total, but not their worst in BBL history.
What was the pitch like at Adelaide Oval for this match?
The pitch at Adelaide Oval offered pace and bounce early, favouring fast bowlers with the new ball. However, spin dominated the middle overs – Shamsi and Pope combined for 6 wickets, confirming Adelaide Oval’s reputation as a spin-friendly venue in the second half of the innings.
What were the key partnerships in this match?
Renegades’ highest partnership was just 24 runs (5th wicket, Jewell and Khan). Adelaide’s first-wicket stand of 37 in 20 balls (Carey and Short) was match-defining. The unbroken third-wicket partnership of 33* between Lynn and Scott closed out the game.